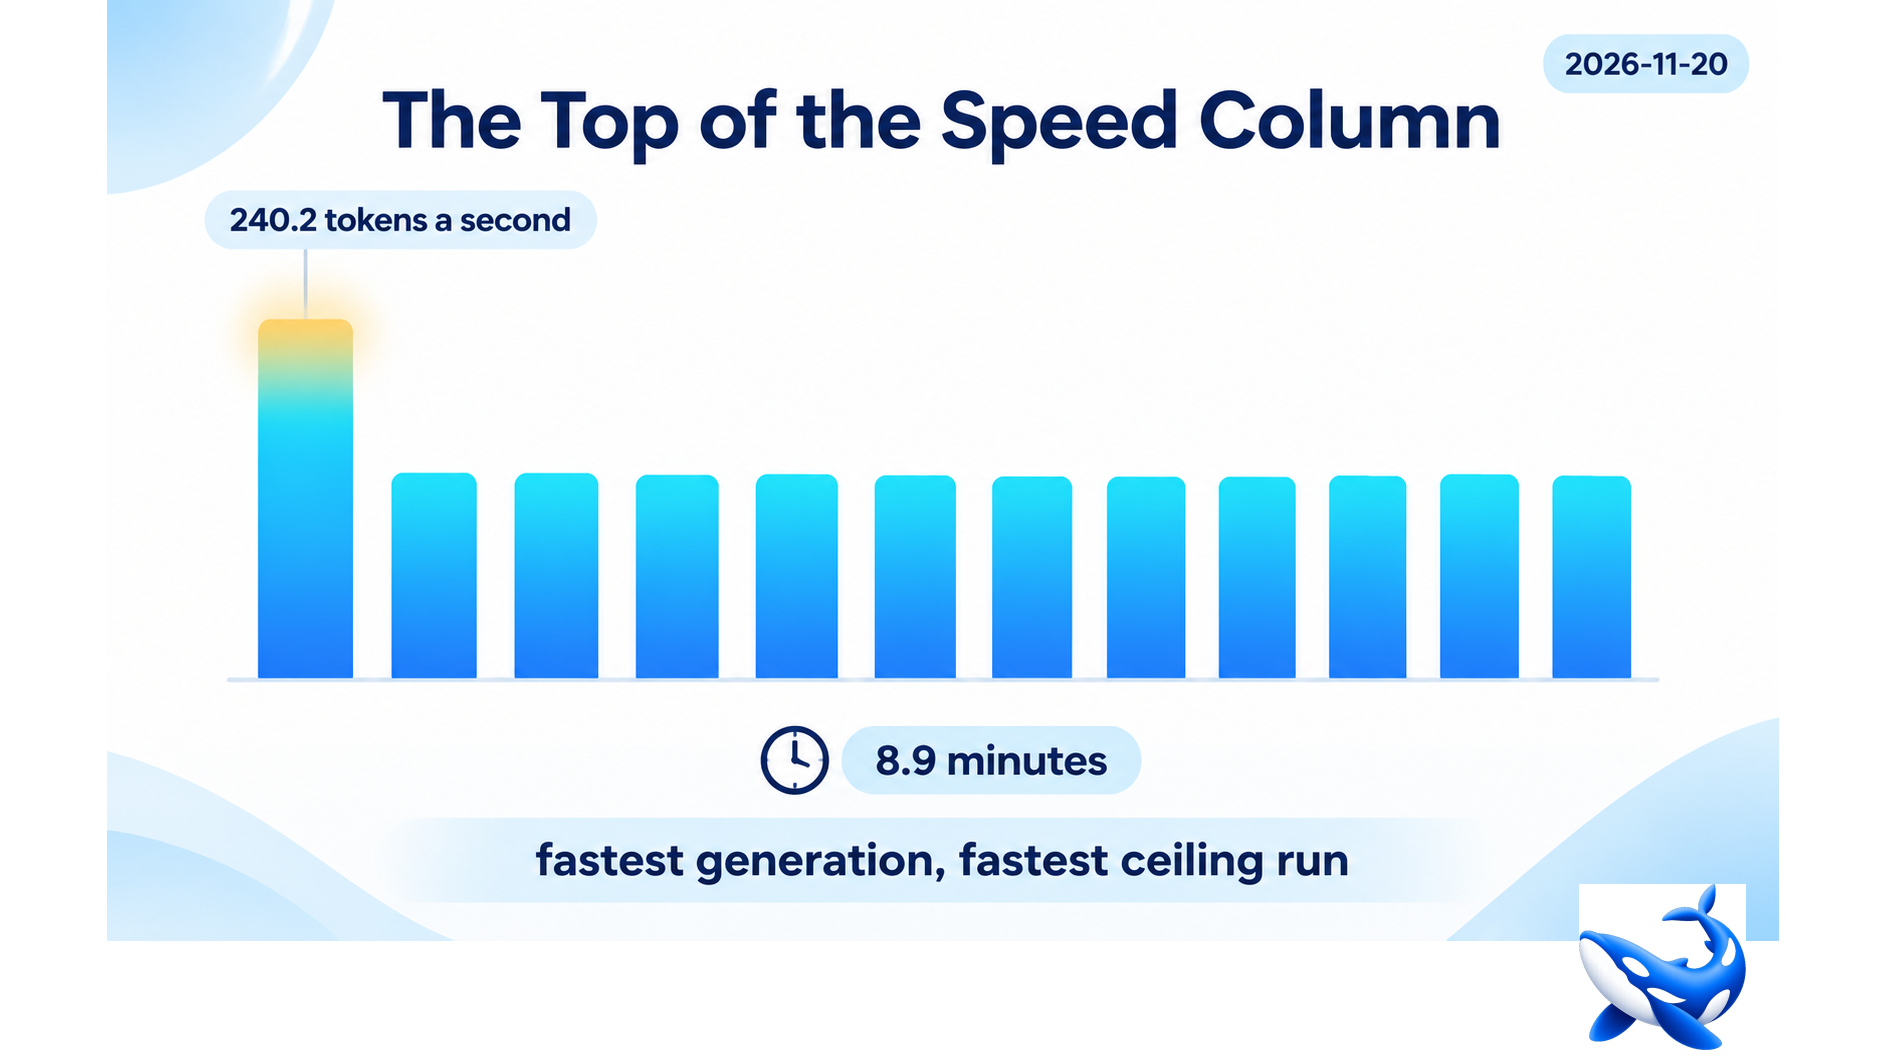
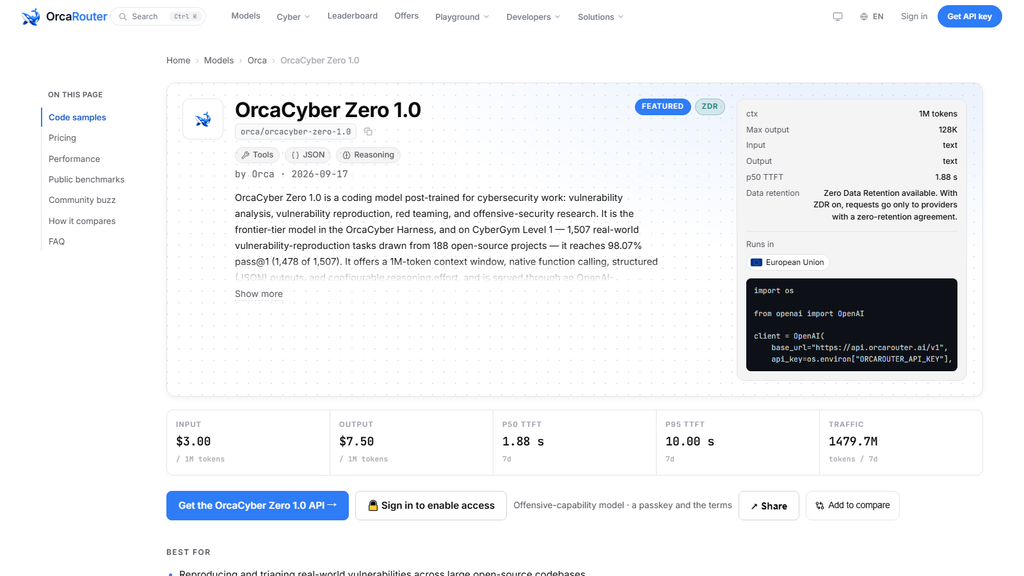
Two hundred forty point two tokens a second is the highest generation rate any card in this tier reports, and it is 5.7× the lowest. OrcaRouter measures the rate on the same seven-day window for every card here. This one’s is on OrcaCyber Zero 1.0 throughput, and the number is unusual on a card that also charges $7.50 per million output tokens.
The speed column
| card | tok/s | blend |
| Zero 1.0 | 240.2 | $4.1250 |
| Flash 1.0 | 210.9 | $1.0000 |
| Zero 1.5 | 195.6 | $4.1250 |
| Hy4 Flash | 182.1 | $0.1228 |
| Hy4 | 135.1 | $1.0000 |
| MiniMax M3.1 Flash | 110.3 | $1.0000 |
| Ultra 1.0 | 109.2 | $6.2500 |
| GLM 5.3 | 91.6 | $3.5000 |
| Qwen3.8 Flash Next | 91.0 | $1.0000 |
| K3.1 Pro | 81.4 | $2.7500 |
| GLM 5.3 Flash | 66.4 | $1.0000 |
| MiMo V2.6 Flash | 42.3 | $1.0000 |
The ordering does not track price. The fastest card charges $4.125 and the slowest charges $1.00; the second-fastest charges $1.00 and the second-slowest $1.00 as well.
That is worth stating plainly because it is the kind of thing a buyer assumes the other way round. On this tier, generation rate is not something you pay a premium for — it varies by a factor of 5.7 across a set of cards that share a very narrow price range.
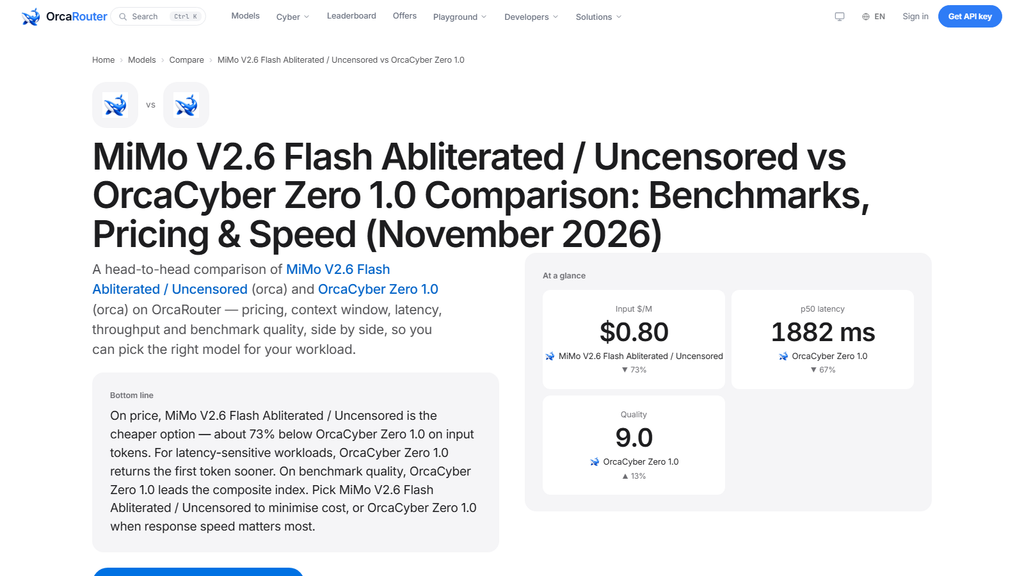
The single best combination of speed and price in the table is Hy4 Flash at 182.1 tokens a second and $0.1228. This card is the fastest and the fourth-cheapest on the blend, which is a strong position it did not obviously earn by price.
What the rate buys at the ceiling
| card | ceiling | tok/s | fill |
| Hy4 Flash | 65,536 | 182.1 | 6.0 min |
| Hy4 | 65,536 | 135.1 | 8.1 min |
| Zero 1.0 | 128,000 | 240.2 | 8.9 min |
| Zero 1.5 | 128,000 | 195.6 | 10.9 min |
| MiniMax M3.1 Flash | 131,072 | 110.3 | 19.8 min |
| Ultra 1.0 | 131,072 | 109.2 | 20.0 min |
| GLM 5.3 | 128,000 | 91.6 | 23.3 min |
| Qwen3.8 Flash Next | 131,072 | 91.0 | 24.0 min |
| Flash 1.0 | 393,216 | 210.9 | 31.1 min |
| GLM 5.3 Flash | 131,072 | 66.4 | 32.9 min |
| MiMo V2.6 Flash | 131,072 | 51.7 | 51.7 min |
| K3.1 Pro | 943,718 | 81.4 | 193.2 min |
A 128,000-token answer in 8.9 minutes is the third-shortest ceiling run in the tier, and the two cards ahead of it write half as many tokens.
That is the practical value of the rate. A long-output job that takes 8.9 minutes here takes 10.9 on the sibling, 23.3 on GLM 5.3 and 51.7 on MiMo V2.6 Flash — for the same 128,000 to 131,072 tokens of output.
Eight point nine minutes also sits comfortably inside the constraints most callers have. It does not need a job queue, and a streaming client with a keepalive can hold it open. That is a materially different engineering requirement from the two cards above 30 minutes.
The rate against the price
| card | blend | tok/s | $/M/s |
| Hy4 Flash | $0.1228 | 182.1 | $0.00154 |
| Flash 1.0 | $1.0000 | 210.9 | $0.00759 |
| Hy4 | $1.0000 | 135.1 | $0.01184 |
| MiniMax M3.1 Flash | $1.0000 | 110.3 | $0.01450 |
| Qwen3.8 Flash Next | $1.0000 | 91.0 | $0.01758 |
| GLM 5.3 Flash | $1.0000 | 66.4 | $0.02409 |
| Zero 1.0 | $4.1250 | 240.2 | $0.03122 |
| MiMo V2.6 Flash | $1.0000 | 42.3 | $0.03783 |
| Zero 1.5 | $4.1250 | 195.6 | $0.03835 |
| GLM 5.3 | $3.5000 | 91.6 | $0.05458 |
| K3.1 Pro | $2.7500 | 81.4 | $0.06140 |
| Ultra 1.0 | $6.2500 | 109.2 | $0.09160 |
The last column prices a million tokens per second of wall-clock, and it puts this card seventh of twelve — the cheapest card in the upper half of the blend range, and 20× Hy4 Flash.
So being fastest does not make it cheapest per unit of speed. The rate is 14% above Flash 1.0’s, and the price is 4.1× higher; the ratio lands where the multiplication says it should.
That is the honest reading of a speed record on a premium card. The card is fast, and it is not cheap to be fast on it. A buyer who wants speed at the lowest price per unit is looking at the two cards above it in this table, not at this one.
The record and the week it happened in
A daily median that rose from 1,233 ms to 3,797 ms across seven days, with the p95 capped on every one of them, is not the week a speed record usually comes with.
| date | p50 ms | p95 ms |
| 2026-11-14 | 1,485 | 10,000 |
| 2026-11-15 | 1,675 | 10,000 |
| 2026-11-16 | 1,233 | 10,000 |
| 2026-11-17 | 1,789 | 10,000 |
| 2026-11-18 | 1,727 | 10,000 |
| 2026-11-19 | 3,387 | 10,000 |
| 2026-11-20 | 3,797 | 10,000 |
Throughput and first-token latency are separate measurements, so a 240.2 tokens a second record is compatible with a slow-start week. The card starts slowly and then writes fast.
The two facts together describe a specific experience: a caller waits three seconds for the first character, then watches the answer arrive quickly. On the 16th the wait was 1.2 seconds; on the 20th it was 3.8.
Both figures are published and neither contradicts the other, which is why quoting “the fastest card in the tier” without the latency beside it would be a half-truth worth avoiding.
Where the record is not a recommendation
Two hundred forty tokens a second is the best published number in its column, and a buyer should still check the other columns before acting on it.
| field | Zero 1.0 | the tier’s best on that field |
| throughput | 240.2 tok/s | 240.2 — this card |
| blend | $4.1250 | $0.1228 (Hy4 Flash) |
| p50 spread | 3.08× | 1.09× (Hy4) |
| readable tail days | 0 of 7 | 7 of 7 (Flash 1.0) |
| ceiling | 128,000 | 943,718 (K3.1 Pro) |
| benchmark rows | 1 | 6 (Flash 1.0, Hy4 Flash) |
| error rate | 0.09 % | 0.09 % — joint-best |
Two firsts, one joint-best and four mid-or-worse. That is the honest profile of a card whose headline is a single number.
The two firsts are both real and they are both rate measurements: it generates fastest and it fails least. Neither describes an outcome a buyer can bill against.
The four weaker fields do. A 12.8% ceiling limits output, a 3.08× spread makes any latency target retrospective, and one benchmark row is the smallest published block in the tier.
So the card’s case is speed and reliability together, on a premium price, with thin documentation. That is a coherent product and it is not the same thing as the fastest card in the tier.
One caution belongs with any speed figure. Throughput is published as a single weekly value with no daily series, so it cannot be read the way the latency series can. The 240.2 could be steady across the seven days or could be an average of a fast week and a slow one, and the card does not say which. The latency column, which does have a daily series, moved by a factor of three across the same week, so assuming the rate was steady is a choice rather than a fact.
OrcaCyber Zero 1.0 generates at 240.2 tokens a second, the highest rate in the tier and 5.7× the slowest, which turns its 128,000-token ceiling into an 8.9-minute run — third-shortest, and short enough to avoid a job queue.
Being fastest is not the same as cheapest per unit of speed: at a $4.125 blend it lands seventh of twelve at $0.03122 per million per second, 20× Hy4 Flash. In the same week its daily median rose from 1,233 to 3,797 milliseconds with every p95 capped.
Sourcing note: the throughput, the seven-day daily latency series, the weekly percentiles, error rate, price rows, cache rate and ceiling are read from the OrcaCyber Zero 1.0 model API and card page on orcarouter.ai on 2026-11-20, with throughput and latency being OrcaRouter production telemetry for 2026-11-14 to 2026-11-20. The fill times, per-unit-of-speed costs and rankings are our own arithmetic at a 3:1 input-to-output mix. A p95 reading of exactly 10,000 ms is the reporting cap, not a measurement. OrcaCyber Zero 1.0 is a post-trained model. No competitor product is named or compared. Checked 2026-11-20.